pyscriptが、いろいろ変わっていて前に作ったものが動かなくなっていたので調べて修正した。
Matplotlibで使うデータを入力できるようなサンプルを作りました。
XとYとグラフタイプを入力できるようにしています。
サンプルプログラムを参考にしただけなので内容は理解していません。
動いているけど仕様にあっているかは分かりません。
また仕様が変わるかもしれないので、たまに動作確認して動きがおかしかったら変更されていないかPyscriptのページを確認しなければならないと思いました。
当記事はpyscriptの2024.11.1版を使っているが2025/3/3時点では2025.2.4版が最新になっていた。
互換性があるかはわからない。
開発環境
Windows11、PythonはAnaconda。
完成品 Matplotlibにデータ入力
完成品(グラフ表示レスポンシブル修正版) Matplotlibにデータ入力

Vsコードのターミナル設定
パソコンを別件で再インストールしたので、開発環境が変わってしまっていた。
(そういえば前も同じことあったなと思ったので記録しておく)
Vsコードのターミナルでpowershellが実行できなくなっていた。
AnacondaをインストールしてPythonの実行環境を作っているので、なぜかわからないがpowershellじゃないとPythonが実行できない。(このpowershellはAnacondaのものなのかWindowsのものなのか、その辺の理解もあいまい)
とにかくChatGptに聞いてpowershellを使えるようにしたら直った。
VSコードのターミナルでこのシステムではスクリプトの実行が無効になっているため、ファイル C:\Users\user\OneDrive\ドキュメント\WindowsPowerShell\profile.ps1 を読み込むことができません。
というエラーが出るのは、PowerShellのスクリプト実行ポリシーが制限されているためです。
🔧 解決方法
次の手順でスクリプトの実行ポリシーを変更すれば、エラーを解消できます。
手順 1: PowerShellを管理者として実行
- Windowsキー + R を押して「ファイル名を指定して実行」を開く
powershellと入力し、Ctrl + Shift + Enter を押す- 「ユーザーアカウント制御 (UAC)」の確認が出たら「はい」をクリック
手順 2: 実行ポリシーを確認
管理者権限で開いたPowerShellで、次のコマンドを実行してください。
Get-ExecutionPolicy -List
これで現在の実行ポリシーが表示されます。
手順 3: 実行ポリシーを変更
以下のコマンドを実行して、スクリプトの実行を許可します。
Set-ExecutionPolicy RemoteSigned -Scope CurrentUser
🔹 意味:
RemoteSigned→ ローカルのスクリプトは実行可能、インターネットから取得したスクリプトは署名が必要-Scope CurrentUser→ 現在のユーザーのみに適用(管理者権限不要)
もしエラーが出た場合:
Set-ExecutionPolicy Unrestricted -Scope CurrentUser
こちらを試すと、完全に制限を解除できます(セキュリティリスクあり)。
手順 4: 設定を確認
もう一度、実行ポリシーを確認します。
Get-ExecutionPolicy
RemoteSigned になっていれば成功です。
手順 5: VSコードを再起動
VSコードを閉じて再起動すると、エラーが解消されているはずです。
🛠 補足
💡 OneDriveが原因の場合
OneDriveにprofile.ps1があるとエラーが出ることがあります。
対処法: profile.ps1 をリネームするか削除する
Rename-Item -Path $PROFILE -NewName "profile_backup.ps1"
その後、VSコードを再起動してください。
試しても解決しなかった場合は、具体的なエラーメッセージを教えてください! 😊
2026/2/25追記、
上記の現象は、Vsコードでターミナルを立ち上げたときAnaconda Power Shellが立ち上がる設定になっている。(Anacondaをインストールした場合)
Anaconda Power Shellを自動するとps1スクリプト(今回、profile.ps1)が、まず実行される。しかし、ExecutionPolicyがデフォルトのRestrictedになっていると、一切ps1スクリプトが実行できないので、エラーになっている。
こちら↓↓にまとめました。
サンプルプログラムをVsコード(ローカル)で実行した
ここにあるサンプルです。https://docs.pyscript.net/2024.11.1/beginning-pyscript
やり方も書いてあります。左上のハンバーガーメニューでは2025/3/3現在2025.2.4版が最新になっていた。後で気づいたの取り敢えず2024.11.1で作っています。互換性に関しては不明。そのまま2025.2.4に変えてもいけるかは未確認。
index.html、pyscript.json、main.pyを同一階層につくります。コードは、上記リンクをコピペ。
私の場合C:\Users\user\pyscript2025_2_3に3つファイルを置いた。
ちなみにindex.htmlをダブルクリックしただけでは、表示はしますが動作はしません。
pyscript.json、main.pyがCORSの問題で読み込めません。
(CORSはややこしいですが、今回はプラウザからパソコンへpyscript.jsonを取り入っているときに発生しています。確かindex.htmlが、どこから来たかプラウザが判定できないので同一オリジン判定できないことが原因のような気がした。)
これは仮想サーバーのPythonコマンドpython3 -m http.serverを実行すればパソコンの中に仮想サーバーが立ち上がりindex.html、pyscript.jsonは同一オリジンから取得することができます。
実際の運用でサーバーに同じ構成でアップロードしておけばCORSの問題は起きないと思います。
具体的手順

ターミナルでpython3 -m http.server または python -m http.serverを実行します。
私の環境の場合python3では動かずpythonで動きました。python3かpythonの違いは、開発環境で違うみたいです。python3 --versionかpython --versionでバージョンが表示されるほうが使えるコマンド指定方法です。ダメなほうはpythonという文字だけ表示します。

この時、注意することはコマンド(python3 -m http.server)実行はindex.html等のファイルがあるところで実行しないとだめです。
このコマンドを実行すると、その場所を仮想サーバーホストのルートディレクトリとして機能します。
実行したらプラウザ(EdgeやChrome)でhttp://localhost:8000/にアクセスすればindex.htmlが自動で読みだされ表示されます。
CTRL+Cでサーバーが止まります。
ターミナルの表示
(base) PS C:\Users\user\pyscript2025_2_3>python -m http.server
Serving HTTP on :: port 8000 (http://[::]:8000/) ...
::1 - - [03/Feb/2025 18:02:35] "GET / HTTP/1.1" 200 -
::1 - - [03/Feb/2025 18:02:36] "GET /pyscript.json HTTP/1.1" 200 -
::1 - - [03/Feb/2025 18:02:40] "GET /main.py HTTP/1.1" 200 -
::1 - - [03/Feb/2025 18:05:20] "GET / HTTP/1.1" 304 -
::1 - - [03/Feb/2025 18:05:20] "GET /pyscript.json HTTP/1.1" 304 -
::1 - - [03/Feb/2025 18:05:22] "GET /main.py HTTP/1.1" 304 -
Keyboard interrupt received, exiting.←CTRL+Cを押した。出来上がったものを動作確認。
ここhttps://arrr.readthedocs.io/en/latest/index.htmlにあった例文「Hello there. How are you?」でtranslateすると「Ahoy there. How be you?」と出てきた。海賊の言葉遣いに翻訳したらしいです。「Ahoy」は「Hello」に相当し、「How be you?」は「How are you?」に相当するらしい。これは、英語を海賊語に変換するアプリみたいです。
main.pyを変更しても反映されない。
開発者ツールを開き(F12)、ネットワークタブで「キャッシュ無効」 をオンにしてリロードすると反映されます。
htmlファイル1個は今後のことも考えてやめたほうがいいかも
以前、作ったhtmlファイル1個のものをChatGptに聞いて何度かエラーがでながらも2024.11.1版で動くように修正できた。
修正(サンプルプログラムを参考に修正)
しかし、こちらのmatplbをつかったほうはChatGptに聞いても行き詰った。
1個のhtmlファイルでは無理そうなので、html以外のファイルも作って修正しました。
サンプルプログラムを参考にしただけで、内容に関しては理解していません。
修正ポイント1
<link rel="stylesheet" href="https://pyscript.net/alpha/pyscript.css" />
<script defer src="https://pyscript.net/alpha/pyscript.js"></script>
      ↓↓↓こちらに変更
<link rel="stylesheet" href="https://pyscript.net/releases/2024.11.1/core.css">
<script type="module" src="https://pyscript.net/releases/2024.11.1/core.js"></script>

修正ポイント2
<py-env>
  - matplotlib
</py-env>
はpyscript.tomlに変更(後述)

修正ポイント3
htmlにおいてある<py-script>のpythonコードはmain.pyという別ファイルに書き換える。
修正ポイント4
サンプルプログラムを参考にする。
今回、基本的な部分と入力部分を参考にしたのがhttps://docs.pyscript.net/2024.11.1/beginning-pyscript/
matlibを参考にしたのがhttps://docs.pyscript.net/2024.11.1/examples/のMatplotlib example
コード
pyscmtpl_new.html、main.py、pyscript.toml(Matplotlib exampleのものをそのまま使っったnameとdescriptionはなくても動いた)を同一階層に作り内容は以下です。
<!DOCTYPE html>
<html lang="ja">
<head>
<meta charset="UTF-8">
<meta name="description" content="Pyscriptを使ってMatplotlibで使うデータを入力できるアプリです。
XとYとグラフタイプを入力できるようにしています。詳細はhttps://kikuichige.com/https://kikuichige.com/11693/"/>
<meta name="viewport" content="width=device-width,initial-scale=1" />
<title>Pyscript+Matplotlib</title>
<link rel="stylesheet" href="https://pyscript.net/releases/2024.11.1/core.css">
<script type="module" src="https://pyscript.net/releases/2024.11.1/core.js"></script>
<script type="module">
const loading = document.getElementById('loading');
addEventListener('py:ready', () => loading.close());
loading.showModal();
</script>
<style type="text/css">
@media screen and (max-width: 960px) {
/* 960px以下適用されるCSS(PC以外用) */
}
body {margin: 0;padding: 0;}
#outer {padding: 0;border-top: 2px solid #7a9f37;
line-height: 1.6;font-family: 'メイリオ', 'Hiragino Kaku Gothic Pro', Meiryo, 'ヒラギノ角ゴ Pro W3', 'MS PGothic', 'MS UI Gothic', Helvetica, Arial, sans-serif;font-size: 93.75%;}
#header {padding: 0;border-bottom:1px #ccc solid;}
#content {background-color:#f8f9fa;}
main {display:block;}
#main {background-color: #fff;margin: 0 auto;width: 800px;padding: 0;}
#inner {padding: 16px 30px 10px 30px;display:block;}
p {margin: 1em 0;word-wrap:break-word;}
#logo {font-size: 16px; padding: 22px 0 22px 0;margin: 0 auto;width: 740px;}
#logo a {font-weight: bold; color: #8c0000; text-decoration: none;padding-left:10px;}
#logo a:hover {text-decoration: underline;}
h1 {font-size: 26px;padding: 0;margin:0;}
h2, h3 {font-size: 24px;padding: 0;border-bottom: 1px solid #ccc;}
<!--追加bigin-->
h1{
font-size: 26px;padding: 0;margin:0;
color: #ff0000;
background-color: #ffffff;
}
.btn{
color: #fff;
background-color: #eb6100;
width: 100px;
height: 30px;
}
.textlines {
border: 2px solid #0a0;
}
<!--追加end-->
h1,p,a{overflow-wrap: break-word;}
.border{
outline:solid 2px blue;
height:30px;
}
@media screen and (min-width: 960px) {
/* 960px以上に適用されるCSS(PC用) */
.max-w-xs mx-auto mt-4 {width:100%;padding: 0;}
}
</style>
</head>
<body>
<main class="max-w-xs mx-auto mt-4">
<dialog id="loading">
<h1>Loading...</h1>
</dialog>
<div id="outer">
<header id="header">
<div id="logo">イチゲブログ2</div>
</header>
<div id="content">
<div id="inner">
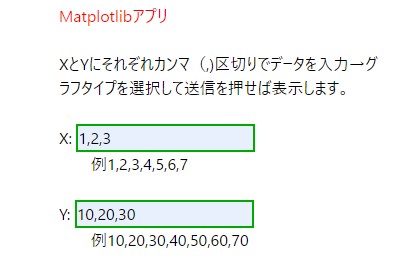
<h1>Matplotlibアプリ</h1>
<br>
<p>このサイトの詳細は<a href="https://kikuichige.com">イチゲブログ</a></p>
<p>XとYにそれぞれカンマ(,)区切りでデータを入力→グラフタイプplotまたはbarを押せば表示します。</p><br>
<div>
<label>X:
<input type="text" class='textlines' value="" id="xvalue" name="xvalue"> </label>
<p> 例1,2,3,4,5,6,7</p>
</div>
<br>
<div>
<label>Y:
<input type="text" class='textlines' value="" id="yvalue" name="yvalue"></label>
<p> 例10,20,30,40,50,60,70</p>
</div>
<br>
<div>
<button class="btn" py-click="setPlot">plot</button>
<button class="btn" py-click="setBar">bar</button>
</div>
<div id="mes"></div>
</div>
</div>
</div>
</main>
<section class="pyscript">
<div id="mpl"></div>
<script type="py" src="./main.py" config="./pyscript.toml"></script>
</section>
</body>
</html>import matplotlib.pyplot as plt
from pyscript import display
from pyscript import document
# データの定義
mode="plot"
x = [1, 2, 3, 4, 5]
y = [10, 20, 30, 40, 50]
def setPlot(event):
mode="plot"
plotfunc(mode)
def setBar(event):
mode="bar"
plotfunc(mode)
def plotfunc(mode0):
mode = mode0
input_text = document.querySelector("#xvalue")
x0 = input_text.value
output_div = document.querySelector("#mes")
input_text = document.querySelector("#yvalue")
y0 = input_text.value
if x0 == '' or y0 == '':
mes = '値を入力してください'
else:
x1 = x0.split(',')
x = [int(s) for s in x1]
y1 = y0.split(',')
y = [int(s) for s in y1]
if len(x) == len(y):
# 以前のグラフをクリア
document.querySelector("#mpl").innerHTML = ""
fig, ax = plt.subplots()
if mode == 'plot':
ax.plot(x, y)
else:
ax.bar(x, y)
plt.title("X-Y var")
plt.xlabel("X")
plt.ylabel("Y")
mes = ''
display(fig, target="mpl")
else:
mes = 'xとyの個数がちがいます'
output_div.innerText = mes
name = "Matplotlib"
description = "A simple application showing how to use Matplotlib to generate a graph and display it with PyScript."
packages = ["matplotlib"]
完成品 Matplotlibにデータ入力
イチゲをOFUSEで応援する(御質問でもOKです)Vプリカでのお支払いがおすすめです。
MENTAやってます(ichige)
完成品 Matplotlibにデータ入力は下の無料のレンタルサーバーにアップロードしてます。

修正(ChatGptに聞いて微調整)
サンプルプログラムを参考にしたものはグラフの大きさがレスポンシブルではなかったのでChatGptに聞いて修正した。ChatGptの答えは今回は使えた。
使えない時は、はやめに見切りをつけないと、どんどん泥沼にはまることもある。
コード
<!DOCTYPE html>
<html lang="ja">
<head>
  <meta charset="UTF-8">
  <meta name="description" content="Pyscriptを使ってMatplotlibで使うデータを入力できるアプリです。
XとYとグラフタイプを入力できるようにしています。詳細はhttps://kikuichige.com/https://kikuichige.com/11693/"/>
<meta name="viewport" content="width=device-width,initial-scale=1" />
  <title>Pyscript+Matplotlib</title>
  <link rel="stylesheet" href="https://pyscript.net/releases/2024.11.1/core.css">
  <script type="module" src="https://pyscript.net/releases/2024.11.1/core.js"></script>
  <script type="module">
    const loading = document.getElementById('loading');
    addEventListener('py:ready', () => loading.close());
    loading.showModal();
  </script>
<style type="text/css">
@media screen and (max-width: 960px) {
	/* 960px以下適用されるCSS(PC以外用) */
}
body {margin: 0;padding: 0;}
#outer {padding: 0;border-top: 2px solid #7a9f37;
line-height: 1.6;font-family: 'メイリオ', 'Hiragino Kaku Gothic Pro', Meiryo, 'ヒラギノ角ゴ Pro W3', 'MS PGothic', 'MS UI Gothic', Helvetica, Arial, sans-serif;font-size: 93.75%;}
/* #header {padding: 0;border-bottom:1px #ccc solid;} */
#header {
  display: flex;        /* フレックスボックスを適用 */
  justify-content: center;  /* 中央寄せ */
  align-items: center;  /* 縦方向の中央揃え */
}
#content {background-color:#f8f9fa;}
main {display:block;}
#mpl img {
    width: 100%;
    max-width: 600px;
    margin: auto;
  }
/* #main {background-color: #fff;margin: 0 auto;width: 800px;padding: 0;} */
#main {background-color: #fff;margin: 0 auto;max-width: 100%;padding: 0;}
#inner {padding: 16px 30px 10px 30px;display:block;}
p {margin: 1em 0;word-wrap:break-word;}
/* #logo {font-size: 16px;	padding: 22px 0 22px 0;margin: 0 auto;width: 740px;} */
#logo {font-size: 16px;	padding: 22px 0 22px 0;margin: 0 auto;width: 100%;text-align: center; }
#logo a {font-weight: bold;	color: #8c0000;	text-decoration: none;padding-left:10px;}
#logo a:hover {text-decoration: underline;}
h1 {font-size: 26px;padding: 0;margin:0;}
h2, h3 {font-size: 24px;padding: 0;border-bottom: 1px solid #ccc;}


<!--追加bigin-->
h1{
  font-size: 26px;padding: 0;margin:0;
  color: #ff0000;
  background-color: #ffffff;
}

.btn{
  color: #fff;
  background-color: #eb6100;
  width: 100px;
  height: 30px;
}
/* .textlines {
    border: 2px solid #0a0;
} */
input.textlines {
    border: 2px solid #0a0;
    width: 100%;
    max-width: 400px;
  }
<!--追加end-->


h1,p,a{overflow-wrap: break-word;}
.border{
outline:solid 2px blue;
height:30px;
}
@media screen and (min-width: 960px) {
	/* 960px以上に適用されるCSS(PC用) */
.max-w-xs mx-auto mt-4 {width:100%;padding: 0;}


}
</style>
</head>

<body>
<main class="max-w-xs mx-auto mt-4">
  <dialog id="loading">
    <h1>Loading...</h1>
</dialog>


<div id="outer">
 <header id="header">
	<div id="logo">イチゲブログ2</div>
 </header>
 <div id="content">

  <div id="inner">
	<h1>Matplotlibアプリ</h1>
    <br>
<p>このサイトの詳細は<a href="https://kikuichige.com/11693/">イチゲブログ</a></p>
    <p>XとYにそれぞれカンマ(,)区切りでデータを入力→グラフタイプplotまたはbarを押せば表示します。</p><br>
  <div>
    <label>X:
    <input type="text" class='textlines' value="" id="xvalue" name="xvalue"> </label>
    <p>  例1,2,3,4,5,6,7</p>
  </div>
      <br>
  <div>
    <label>Y:
    <input type="text" class='textlines' value="" id="yvalue" name="yvalue"></label>
    <p>  例10,20,30,40,50,60,70</p>
  </div>
    <br>

<div>
  <button class="btn" py-click="setPlot">plot</button>
  <button class="btn" py-click="setBar">bar</button>

</div>

  <div id="mes"></div>
</div>
</div>
</div>
</main>

<section class="pyscript">
  <div id="mpl"></div>
  <script type="py" src="./main1.py" config="./pyscript.toml"></script>
</section>
</body>
</html>import matplotlib.pyplot as plt
from pyscript import display, document
def setPlot(event):
plotfunc("plot")
def setBar(event):
plotfunc("bar")
def plotfunc(mode):
input_text = document.querySelector("#xvalue")
x0 = input_text.value
input_text = document.querySelector("#yvalue")
y0 = input_text.value
output_div = document.querySelector("#mes")
if not x0 or not y0:
output_div.innerText = '値を入力してください'
return
try:
x = [int(s) for s in x0.split(',')]
y = [int(s) for s in y0.split(',')]
if len(x) != len(y):
output_div.innerText = 'xとyの個数がちがいます'
return
document.querySelector("#mpl").innerHTML = ""
fig, ax = plt.subplots(figsize=(8, 6))
if mode == "plot":
ax.plot(x, y, marker="o", linestyle="-")
else:
ax.bar(x, y)
plt.title("X-Y Graph")
plt.xlabel("X Axis")
plt.ylabel("Y Axis")
plt.tight_layout()
display(fig, target="mpl", append=False) # ← これを追加
except Exception as e:
output_div.innerText = f'エラー: {str(e)}'
完成品(グラフ表示サイズ修正版) Matplotlibにデータ入力
ここから下は2024/2/4以前の内容です
Pyscriptをいろいろ実験したまとめです。
Matplotlibで使うデータを入力できるようなサンプルを作りました。
XとYとグラフタイプを入力できるようにしています。
Pyscriptの欠点として動き始めるまで時間がかかります。
下の完成品も動くまで下の方にloading runtime…と出てると思います。
それが消えるまで動作しません。
完成品 Matplotlibにデータ入力(https)
完成品 Matplotlibにデータ入力(http)
Pyscriptを使用するときはhtmlファイルのheadタグの中に以下2行追加だけで使えます。
2025/2/1追記
動かなくなった。原因は以下のpyscriptファイルが読み込めていない(404エラー)。どうやら削除されたみたい。
違うところになったみたい、さらに仕様も変更されているようなので調査中。
<link rel="stylesheet" href="https://pyscript.net/alpha/pyscript.css" />
<script defer src="https://pyscript.net/alpha/pyscript.js"></script>
</head>
Htmlの知識不要、PythonのみでできるStreamlitもおすすめです。

旧(2024/11/1以前の内容) <py-script>と<script>は違う
<py-script>と<script>で同じように使えるものと使えないものがある。
varやconstなどは<py-script>では使えない。
pythonでは型の定義がないからだと思います。
何が使えるかは最初<script>で作って動かし
<py-script>に変更すると使えないものは使えなくなるので判断できます。
Elementオブジェクトについて違いが分かるサンプルを用意しました。
<b>タグは囲まれたテキストが太字になります。
太文字 これを実行すると以下のようになります。
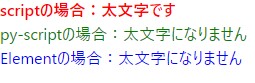
赤文字は<script>内でdocument.getElementByIdを使用したもの。
緑色は<py-script>内でdocument.getElementByIdを使用したもの。
青色は<py-script>内でdocument.getElementByIdではなくElementを使用したものになります。
<!DOCTYPE html>
<html lang="ja">
<head>
  <meta charset="utf-8" />
  <title>太文字</title>
  <link rel="stylesheet" href="https://pyscript.net/alpha/pyscript.css" />
  <script defer src="https://pyscript.net/alpha/pyscript.js"></script>
</head>

<body>
  <p id="p1"></p>
  <p id="p2"></p>
  <p id="p3"></p>

<script>
	const p1 = document.getElementById('p1')
	p1.innerHTML = '<b>scriptの場合:太文字です</b>'
  p1.style.color='red'
</script>

<py-script>
  p2 = document.getElementById('p2')
  p2.innerHTML = '<b>py-scriptの場合:太文字になりません</b>'
  p2.style.color='green'
  p3 = Element('p3')
  p3.element.innerText = '<b>Elementの場合:太文字になりません</b>'
  p3.element.style.color='blue'
</py-script>

</body>
</html>
<script>は型定義(const)が必要<py-script>は不要
<script>はinnerHTMLでタグを変更できる。<py-script>はinnerHTMLでテキストのみの変更になる。
<py-script>ではdocument.getElementByIdのかわりにElementが使える。(公式のサンプルを見るとElementが使われている。)
Elementを取得した場合は.elementを付ける。
<script>で以下のようにElementにしてみたが反応がなかった。
const p1 = Element('p1');
JavaScriptでは文末に;を書くが<script>内でも;なくても大丈夫だった。
いろいろ書きましたがpy-scriptに関して情報が少ないので
紹介したように、まず<script>で作って<py-script>にしてみるのも手です。
今回の値を入力する部分
plotとbarはボタンを押したときの関数で区別しています。
<button id ="plot" class="btn" pys-onClick="setPlot">plot</button>
<button id="bar" class="btn" pys-onClick="setBar">bar</button>

値の取得は各関数内で
<label>X:
    <input type="text" class='textlines' value="" id="xvalue" name="xvalue"> </label>
  x_element = Element("xvalue")  id="xvalue"の要素を取得してx_elementに代入。
  x0 = x_element.element.value  x_elementのvalue(値)をx0に代入
x0は文字列ですので数字とリストに変換する処理を後でしています。
以下のように関数の外で定義した変数はJupiterNotebookなどと違い
ボタンを押すたびに毎回実行されるようなので注意が必要です。
変数の中に値を保持しておくことはできないようです。
入力欄のほうには残るので毎回読み込むようにしてます。
<py-script>
import matplotlib.pyplot as plt
mode="plot"
x=[]
y=[]旧(2024/11/1以前の内容) CSS
<link rel="stylesheet" href="https://pyscript.net/alpha/pyscript.css" /><py-script>を読み込んでいるので
Pyscript DEMOのソースから対象要素のclass名をコピーすれば、スタイルが真似できます。
今回はToDoリストのtodo.htmlから<main class="max-w-xs mx-auto mt-4">をコピーして全体のスタイルを真似しています。
逆に読み込んだcssの影響でh1タグとかは文字を大きくしたかったのですが思うようにスタイルを変更できませんでした。
大きく表示したい場合はclass="max-w-xs mx-auto mt-4"を削除すればCSSが外れて大きく表示します。
旧(2024/11/1以前の内容) コード
<!DOCTYPE html>
<html lang="ja">
<head>
  <meta charset="UTF-8">
  <meta name="description" content="Pyscriptを使ってMatplotlibで使うデータを入力できるアプリです。
XとYとグラフタイプを入力できるようにしています。詳細はhttps://kikuichige.com/https://kikuichige.com/11693/"/>
<meta name="viewport" content="width=device-width,initial-scale=1" />
  <title>Pyscript+Matplotlib</title>

<script defer src="https://pyscript.net/alpha/pyscript.js"></script>
<py-env>
  - matplotlib
</py-env>
<style type="text/css">
@media screen and (max-width: 960px) {
	/* 960px以下適用されるCSS(PC以外用) */
<link rel="stylesheet" href="https://pyscript.net/alpha/pyscript.css" />
}
body {margin: 0;padding: 0;}
#outer {padding: 0;border-top: 2px solid #7a9f37;
line-height: 1.6;font-family: 'メイリオ', 'Hiragino Kaku Gothic Pro', Meiryo, 'ヒラギノ角ゴ Pro W3', 'MS PGothic', 'MS UI Gothic', Helvetica, Arial, sans-serif;font-size: 93.75%;}
#header {padding: 0;border-bottom:1px #ccc solid;}
#content {background-color:#f8f9fa;}
main {display:block;}
#main {background-color: #fff;margin: 0 auto;width: 800px;padding: 0;}
#inner {padding: 16px 30px 10px 30px;display:block;}
p {margin: 1em 0;word-wrap:break-word;}
#logo {font-size: 16px;	padding: 22px 0 22px 0;margin: 0 auto;width: 740px;}
#logo a {font-weight: bold;	color: #8c0000;	text-decoration: none;padding-left:10px;}
#logo a:hover {text-decoration: underline;}
h1 {font-size: 26px;padding: 0;margin:0;}
h2, h3 {font-size: 24px;padding: 0;border-bottom: 1px solid #ccc;}


<!--追加bigin-->
h1{
  font-size: 26px;padding: 0;margin:0;
  color: #ff0000;
  background-color: #ffffff;
}

.btn{
  color: #fff;
  background-color: #eb6100;
  width: 100px;
  height: 30px;
}
.textlines {
    border: 2px solid #0a0;
}

<!--追加end-->


h1,p,a{overflow-wrap: break-word;}
.border{
outline:solid 2px blue;
height:30px;
}
@media screen and (min-width: 960px) {
	/* 960px以上に適用されるCSS(PC用) */
.max-w-xs mx-auto mt-4 {width:100%;padding: 0;}


}
</style>
</head>

<body>
<main class="max-w-xs mx-auto mt-4">


<div id="outer">
 <header id="header">
	<div id="logo">イチゲブログ2</div>
 </header>
 <div id="content">

  <div id="inner">
	<h1>Matplotlibアプリ</h1>
    <br>
<p>このサイトの詳細は<a href="https://kikuichige.com">イチゲブログ</a></p>
    <p>XとYにそれぞれカンマ(,)区切りでデータを入力→グラフタイプplotまたはbarを押せば表示します。</p><br>
  <div>
    <label>X:
    <input type="text" class='textlines' value="" id="xvalue" name="xvalue"> </label>
    <p>  例1,2,3,4,5,6,7</p>
  </div>
      <br>
  <div>
    <label>Y:
    <input type="text" class='textlines' value="" id="yvalue" name="yvalue"></label>
    <p>  例10,20,30,40,50,60,70</p>
  </div>
    <br>

<div>
  <button id ="plot" class="btn" pys-onClick="setPlot">plot</button>
  <button id="bar" class="btn" pys-onClick="setBar">bar</button>
</div>

  <div id="mes"></div>
  <div id="plotfig"></div>


</div>
</div>
</div>
</main>

<py-script>
import matplotlib.pyplot as plt
mode="plot"
x=[]
y=[]
def setPlot(*ags,**kws):
  mode="plot"
  plotfunc(mode)

def setBar(*ags,**kws):
  mode="bar"
  plotfunc(mode)

def plotfunc(mode0):
  mode=mode0
  x_element = Element("xvalue")
  y_element = Element("yvalue")
  x0 = x_element.element.value
  y0 = y_element.element.value
  if x0=='' or y0=='':
    mes='値を入力してください'
  else:
    x1=x0.split(',')
    x=[int(s) for s in x1]
    y1=y0.split(',')
    y=[int(s) for s in y1]
    if len(x)==len(y):
      fig, ax = plt.subplots()
      if mode=='plot':
        ax.plot(x,y)
      else:
        ax.bar(x,y)
      plt.title("X-Y var")
      plt.xlabel("X")
      plt.ylabel("Y")
      mes=''
      pyscript.write('plotfig',fig)
    else:
      mes='xとyの個数がちがいます'

  pyscript.write("mes",mes)

</py-script>

</body>
</html>
コメント